The Dubai real estate market report December 2025 shows a strong finish to the year. Total property sales in December reached AED 46.4 billion, with 17,307 transactions recorded during the month. This marked a 30.64% year-on-year rise, confirming steady buyer confidence in the Dubai property market.
Activity remained spread across both affordable and premium communities, with Majan, Jumeirah Village Circle, Dubai South, Business Bay, and Grand Polo Club & Resort leading in transaction volume.
Larger homes stood out, as 6 and 7-bedroom units recorded the highest number of sales, showing a clear shift toward spacious family living and long-term ownership. Overall, December closed as one of the most active months, setting a strong base for 2026.
Dubai property market December 2025 saw some areas emerge as clear hotspots for property transactions. From apartments to villas, these communities recorded the highest sales activity. The following highlights show the key areas driving the market.

Majan saw strong apartment sales, with studios and 1-bedroom units dominating total transactions. Average prices remained attractive, supporting both investor and end-user demand.
Bedroom Breakdown
|
Bedroom Type |
Total Price (AED) |
No. of Transactions |
Average Price (AED) |
Average Price (AED/sq ft) |
|
Studio |
721,242,361 |
1,023 |
705,027 |
1,826 |
|
1 Bed |
434,007,999 |
391 |
1,109,995 |
1,370 |
|
2 Bed |
122,973,518 |
86 |
1,429,925 |
1,132 |
|
3 Bed |
28,140,012 |
13 |
2,164,616 |
1,112 |
|
4 Bed |
4,908,800 |
2 |
2,454,400 |
1,158 |
Property Type Breakdown Table
|
Property Type |
Volume |
Total Sales Price (AED) |
Total Built-up Area (sq ft) |
Avg Sales Price (AED) |
Avg Built-up Area (sq ft) |
Avg Price (AED/sq ft) |
|
Apartment |
1,516 |
1,312,911,637 |
862,456 |
866,037 |
569 |
1,661 |
|
Overall |
1,516 |
1,312,911,637 |
862,456 |
866,037 |
569 |
1,661 |

JVC led volume with 1-bedroom apartments, while townhouses and villas captured higher-value buyers. Pricing stayed stable across mid-sized and larger units.
Bedroom Breakdown
|
Bedroom Type |
Total Price (AED) |
No. of Transactions |
Average Price (AED) |
Average Price (AED/sq ft) |
|
Studio |
323,957,771 |
452 |
716,721 |
1,755 |
|
1 Bed |
935,697,820 |
796 |
1,175,500 |
1,495 |
|
2 Bed |
275,449,627 |
158 |
1,743,352 |
1,310 |
|
3 Bed |
67,061,288 |
25 |
2,682,452 |
1,478 |
|
4 Bed |
18,849,000 |
5 |
3,769,800 |
1,164 |
Property Type Breakdown Table
|
Property Type |
Volume |
Total Sales Price (AED) |
Total Built-up Area (sq ft) |
Avg Sales Price (AED) |
Avg Built-up Area (sq ft) |
Avg Plot Size (sq ft) |
Avg Price (AED/sq ft) |
|
Apartment |
1,421 |
1,567,926,506 |
1,051,608 |
1,103,397 |
740 |
– |
1,560 |
|
Townhouse |
15 |
44,309,000 |
41,488 |
2,953,933 |
2,766 |
1,981 |
1,087 |
|
Villa |
2 |
11,350,000 |
6,345 |
5,675,000 |
3,173 |
6,970 |
1,786 |
|
Overall |
1,438 |
1,623,585,506 |
1,099,441 |
1,129,058 |
765 |
2,568 |
1,555 |

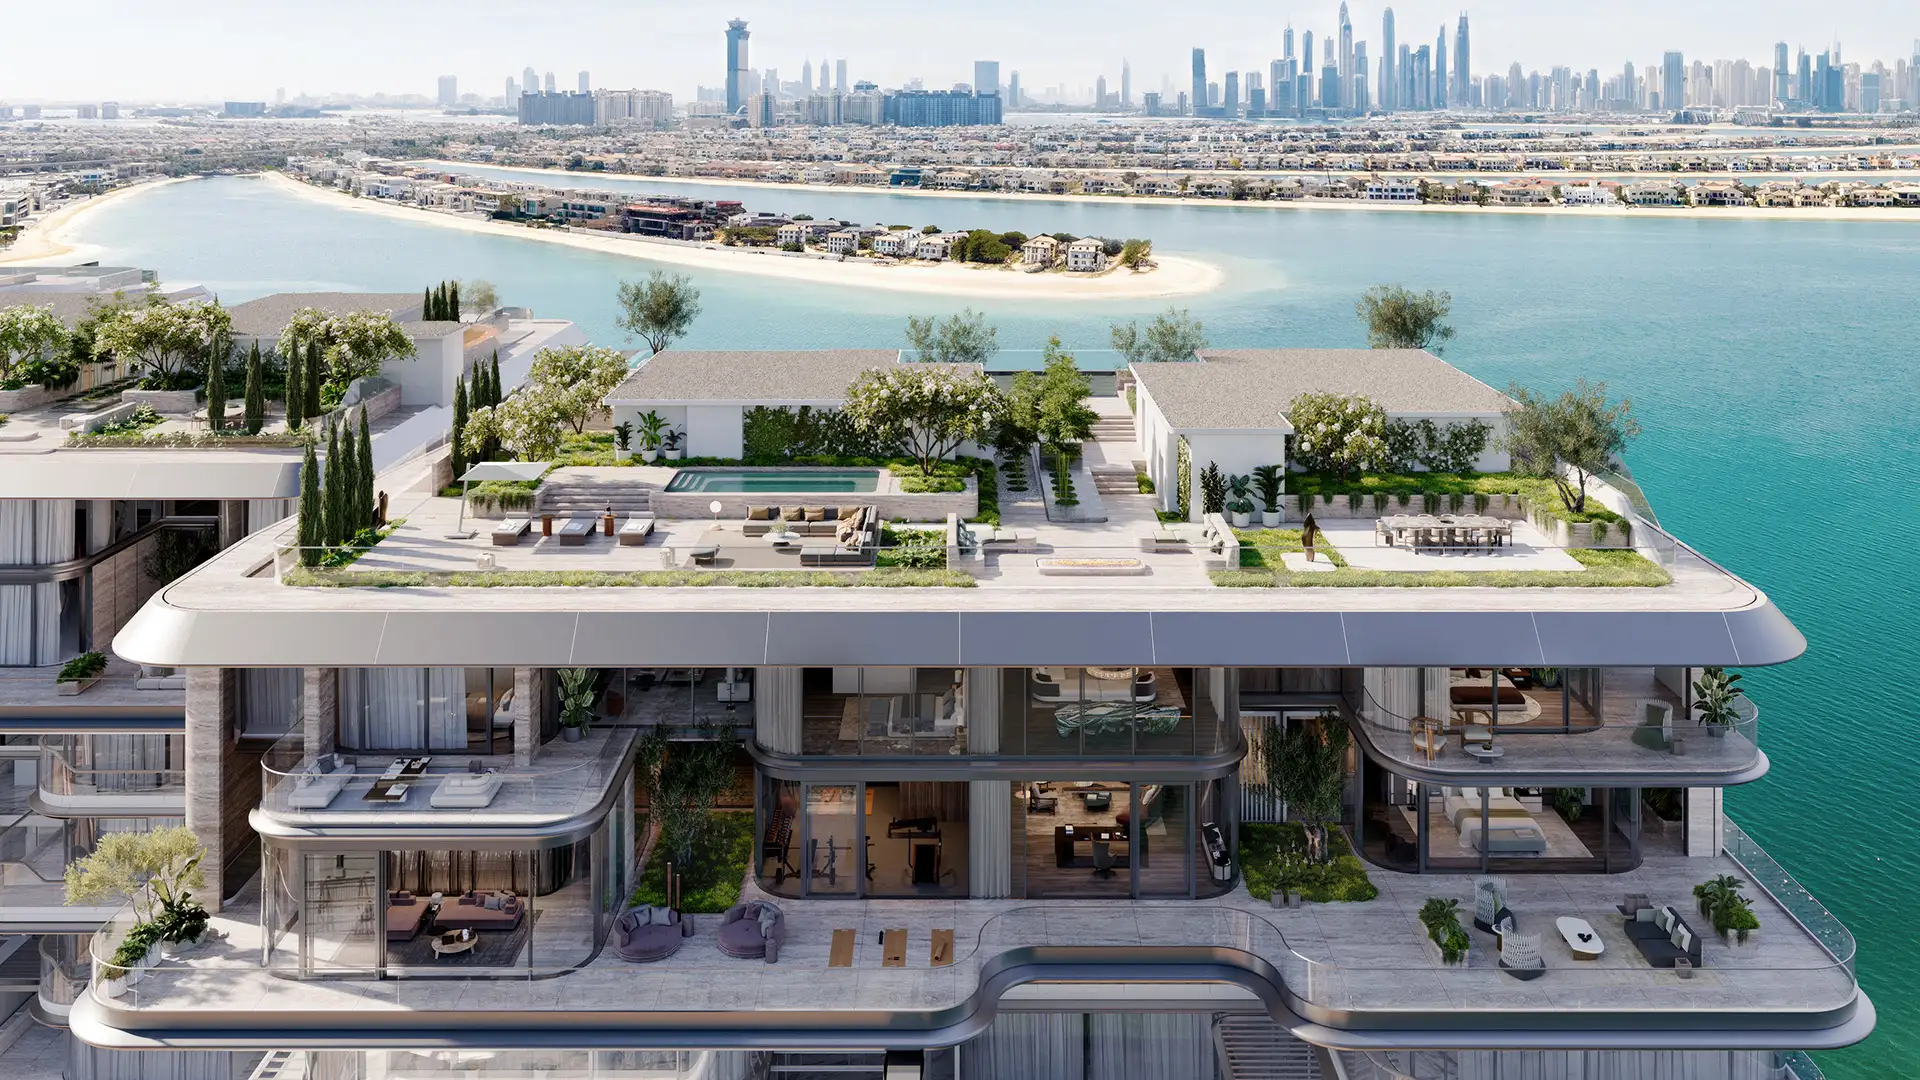
Business Bay’s high-value apartment transactions dominated the market, with studios to 6-bedroom units attracting both investors and premium buyers. Luxury units commanded the highest price per square foot.
Bedroom Breakdown
|
Bedroom Type |
Total Price (AED) |
No. of Transactions |
Average Price (AED) |
Average Price (AED/sq ft) |
|
Studio |
101,539,056 |
178 |
570,444 |
1,472 |
|
1 Bed |
465,225,361 |
363 |
1,281,613 |
1,710 |
|
2 Bed |
589,306,235 |
316 |
1,864,893 |
1,606 |
|
3 Bed |
134,757,995 |
46 |
2,929,522 |
1,412 |
|
4 Bed |
221,334,138 |
49 |
4,517,023 |
1,234 |
|
5 Bed |
232,849,000 |
34 |
6,848,500 |
1,302 |
|
6 Bed |
21,500,000 |
2 |
10,750,000 |
1,392 |
Property Type Breakdown Table
|
Property Type |
Volume |
Total Sales Price (AED) |
Total Built-up Area (sq ft) |
Avg Sales Price (AED) |
Avg Built-up Area (sq ft) |
Avg Plot Size (sq ft) |
Avg Price (AED/sq ft) |
|
Apartment |
873 |
1,200,851,074 |
736,857 |
1,375,545 |
844 |
– |
1,624 |
|
Townhouse |
103 |
444,860,711 |
363,360 |
4,319,036 |
3,528 |
3,460 |
1,233 |
|
Villa |
37 |
194,684,398 |
119,854 |
5,261,740 |
8,561 |
22,636 |
1,475 |
|
Overall |
1,013 |
1,840,396,183 |
1,220,071 |
1,816,778 |
1,232 |
8,601 |
1,581 |

Business Bay remained a top performer in the Dubai real estate market report December 2025, attracting both investors and end-users due to its central location and premium offerings.
Bedroom Breakdown
|
Bedroom Type |
Total Price (AED) |
No. of Transactions |
Average Price (AED) |
Average Price (AED/sq ft) |
|
Studio |
310,064,828 |
253 |
1,225,553 |
2,667 |
|
1 Bed |
833,218,127 |
386 |
2,158,596 |
2,509 |
|
2 Bed |
926,454,526 |
239 |
3,876,379 |
2,471 |
|
3 Bed |
392,922,019 |
55 |
7,144,037 |
2,678 |
|
4 Bed |
44,317,405 |
7 |
6,331,058 |
2,058 |
|
5 Bed |
27,799,660 |
1 |
27,799,660 |
4,073 |
|
6 Bed |
575,100,000 |
2 |
287,550,000 |
7,642 |
Property Type Breakdown
|
Property Type |
Volume |
Total Sales Price (AED) |
Total Built-up Area (sq ft) |
Avg Sales Price (AED) |
Avg Built-up Area (sq ft) |
Avg Price (AED/sq ft) |
|
Apartment |
943 |
3,109,876,565 |
1,016,088 |
3,297,854 |
1,078 |
2,561 |
|
Overall |
943 |
3,109,876,565 |
1,016,088 |
3,297,854 |
1,078 |
2,561 |

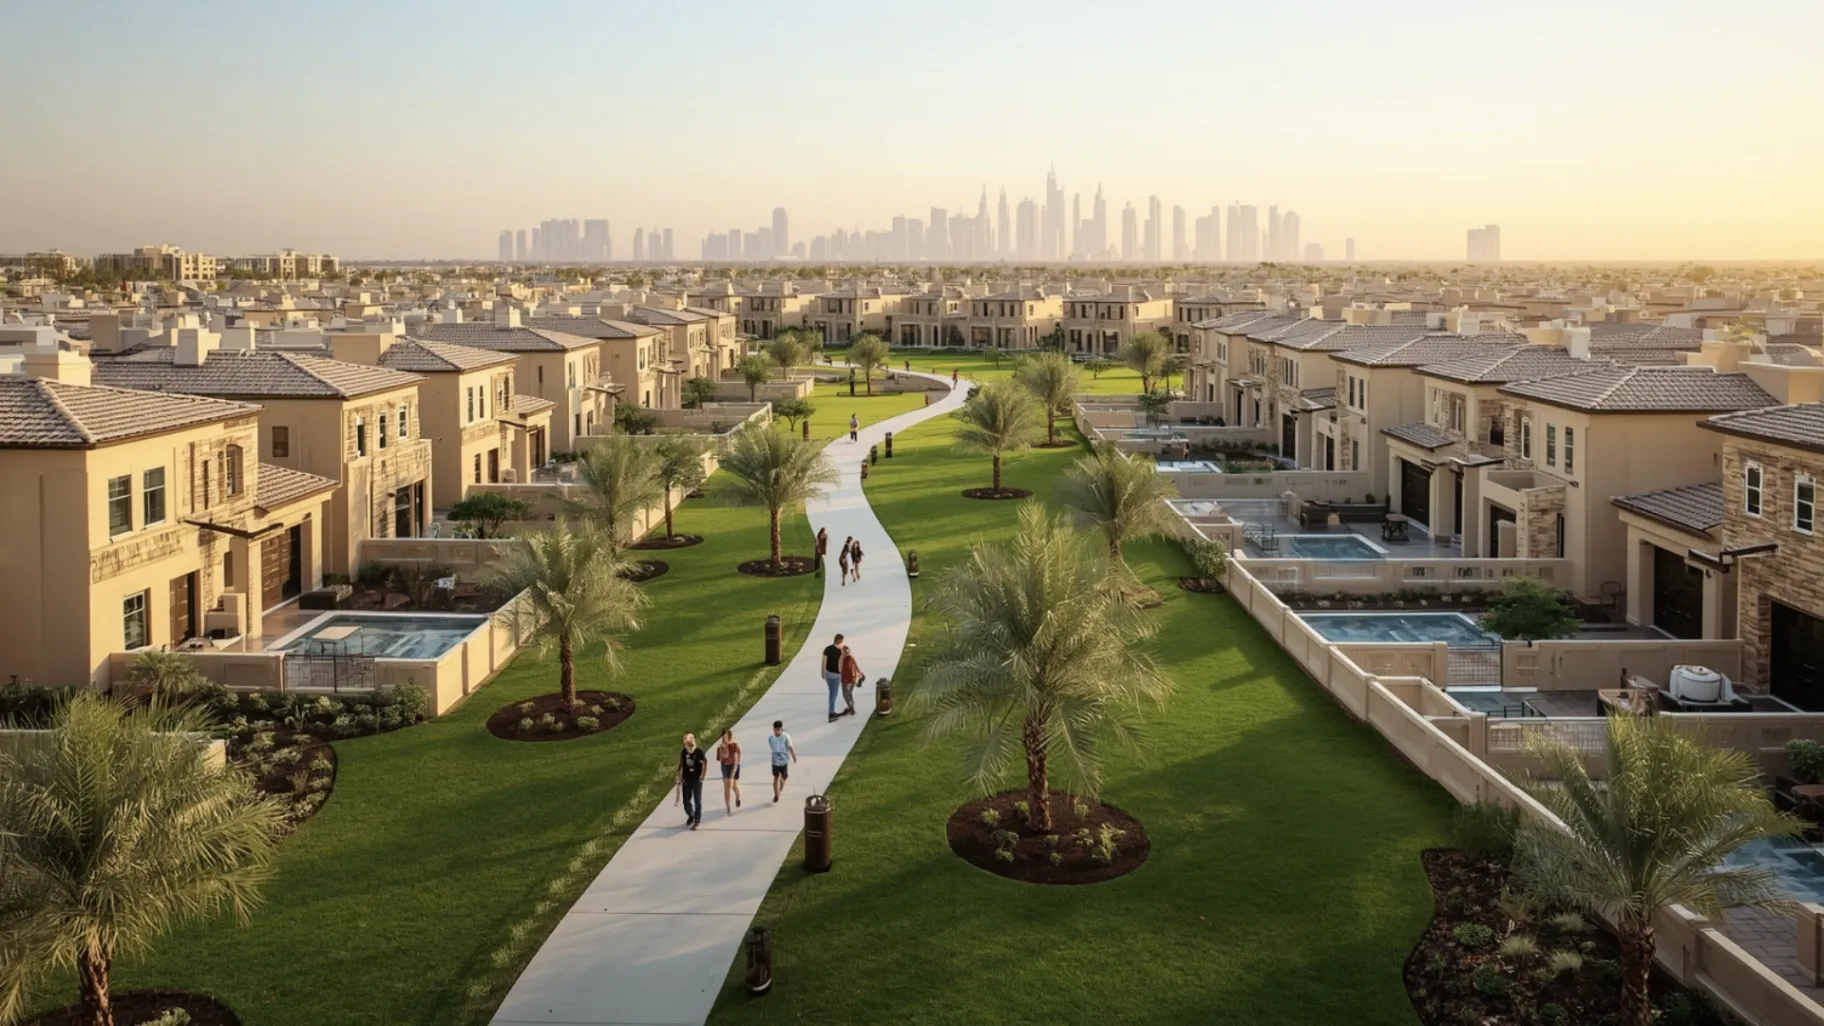
Townhouses drove total transactions, while 3 and 4-bedroom homes led bedroom-wise sales. Villas attracted high-net-worth buyers seeking larger, premium properties.
Bedroom Breakdown
|
Bedroom Type |
Total Price (AED) |
No. of Transactions |
Average Price (AED) |
Average Price (AED/sq ft) |
|
3 Bed |
2,062,077,071 |
568 |
3,630,417 |
1,670 |
|
4 Bed |
1,619,917,417 |
339 |
4,778,517 |
1,913 |
|
5 Bed |
10,073,000 |
1 |
10,073,000 |
2,039 |
Property Type Breakdown
|
Property Type |
Volume |
Total Sales Price (AED) |
Total Built-up Area (sq ft) |
Avg Sales Price (AED) |
Avg Built-up Area (sq ft) |
Avg Plot Size (sq ft) |
Avg Price (AED/sq ft) |
|
Townhouse |
901 |
3,638,366,886 |
2,058,380 |
4,038,143 |
2,285 |
2,104 |
1,760 |
|
Villa |
7 |
53,700,602 |
28,051 |
7,671,515 |
4,007 |
4,591 |
1,908 |
|
Overall |
908 |
3,692,067,488 |
2,086,431 |
4,066,154 |
2,298 |
2,123 |
1,761 |
As per our Dubai real estate market November 2025, this was a strong month for the real estate market, with total sales reaching AED 46.4 billion across 17,307 transactions. Key areas that performed exceptionally included Majan, Jumeirah Village Circle, Dubai South, Business Bay, and Grand Polo Club & Resort. The most traded units were the 6 and 7-bedroom properties, while off-plan apartments continued to drive a majority of the sales. These trends highlight the sustained investor confidence and growing demand in the Dubai property market in 2025.
If you are planning to invest in Dubai real estate, contact Primo Capital today. We can guide you with clear details on area performance, pricing, unit types, and upcoming handovers. Let’s start your property journey now.
Feel Free to Contact Us at Any Time, We Are Online 24/7